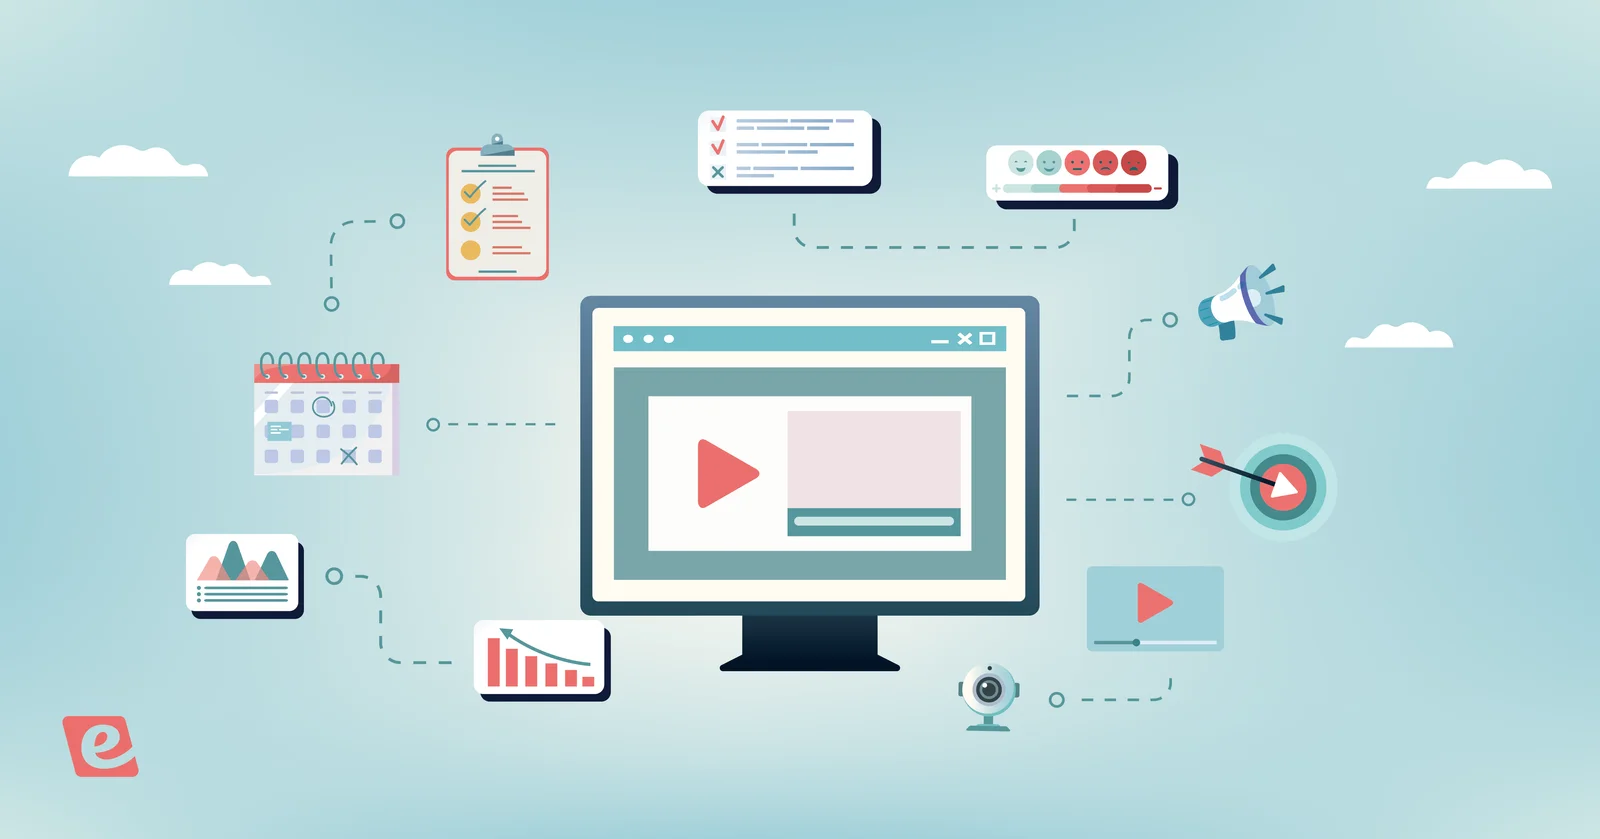
Webinar analytics are the most objective way to measure performance and return on investment. This guide will walk you through how to evaluate webinar analytics, which metrics to pay attention to, and how to use data to make your next webinar a success.
NOTE: Some of the examples and screenshots below come from our webinar platform, eWebinar, but the strategies in this guide can be applied to other software. If any analytics features below are exclusive to our product, we'll be sure to let you know!
Let's dive in!
What are webinar analytics?
Webinar analytics are metrics and data that give you high-level insights into the historical performance of your webinars through statistics, charts, graphs, and other report types.
Benefits of webinar analytics
There are countless benefits to tracking your webinar analytics but here are a few core advantages:
-
Data-driven decisions. Business intelligence (BI) — the process of analyzing data and distributing insights to executives/managers — helps your team members make better decisions by virtue of having more information available to them.
-
Better presentations. Whether you're hosting webinars live or recording the presentation ahead of time, having more data available will help you find ways to resonate with the audience and get them to convert. Being able to see the point where attention drops off will also help you retain your audience longer.
-
Return on investment. Being able to verify the impact of webinars for yourself and prove the return on investment to others is only possible with robust analytics. This also helps monitor the number of conversions relative to the amount of time, money, and effort spent on webinars.
-
Goal tracking. Analytics provide a quantitative measure of how you're progressing towards your webinar goals. Tracking these metrics will give you regular feedback on how well each presentation is performing.
The combination of these benefits culminates in more people watching your webinars for longer with higher conversion rates — all with clearer measures for return on investment and progress towards business objectives.
5 webinar metrics you should track
Now that you know what the benefits of webinar analytics are, it's time to have a look at how to implement a tracking strategy. After all, measuring webinar performance is all about figuring out which specific metrics to look at.
The five most important metrics for measuring a webinar's performance are:
-
Registration rate
-
Attendance rate
-
Average watch time
-
Engagement rate
-
Conversion rate
Let's take a closer look at each of these!
Tip: Optimizing each metric will increase the overall performance of your webinar sales funnel.
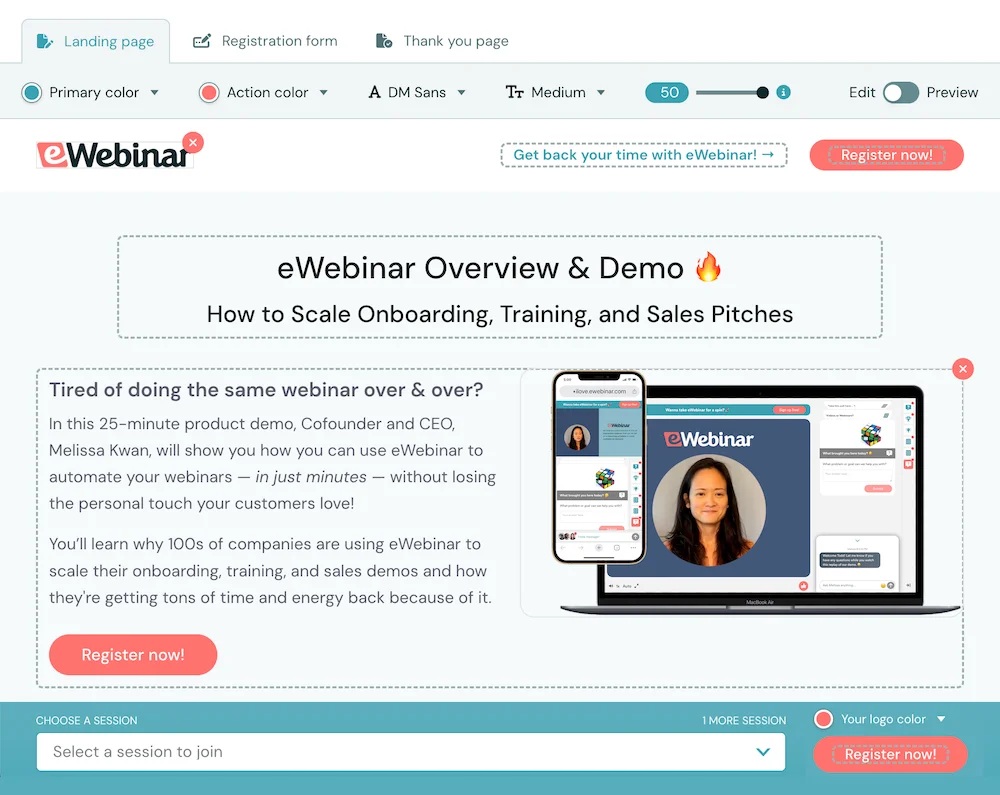
1. Registration rate
The registration rate can be measured by calculating landing page visitors versus the number of webinar registrants. If 100 people land on your webinar registration page but only 10 of them register, you have a 10% registration rate.
The average registration rate is around 30% for cold traffic that reaches your webinar landing page. How many registrants you get relative to the amount of traffic will help you benchmark the landing page’s performance.
Half would be excellent, a third is typical, and less than a quarter is suboptimal.
In general, you should aim for somewhere in the middle with a third of landing page visitors clicking through to the registration page or submitting the signup form. Of course, these benchmarks are just averages and are bound to vary by industry.
The number of registrants you ultimately get has a lot to do with your webinar marketing strategy. No matter how compelling the message is, it won't perform very well if the wrong person is reading it.
Once you start getting qualified leads, there are four questions that your webinar landing page will need to answer for a visitor to turn into a registrant:
-
Is this for me?
-
Who’s behind this training?
-
Can I trust what they’re teaching?
-
When can I watch?
If you answer all four questions in a satisfactory and efficient manner, you'll be far more likely to acquire leads for your webinar presentation.
To learn more about getting the right people to your webinar landing pages, read our full guide on 25 Ways to Promote An On-Demand Evergreen Webinar!
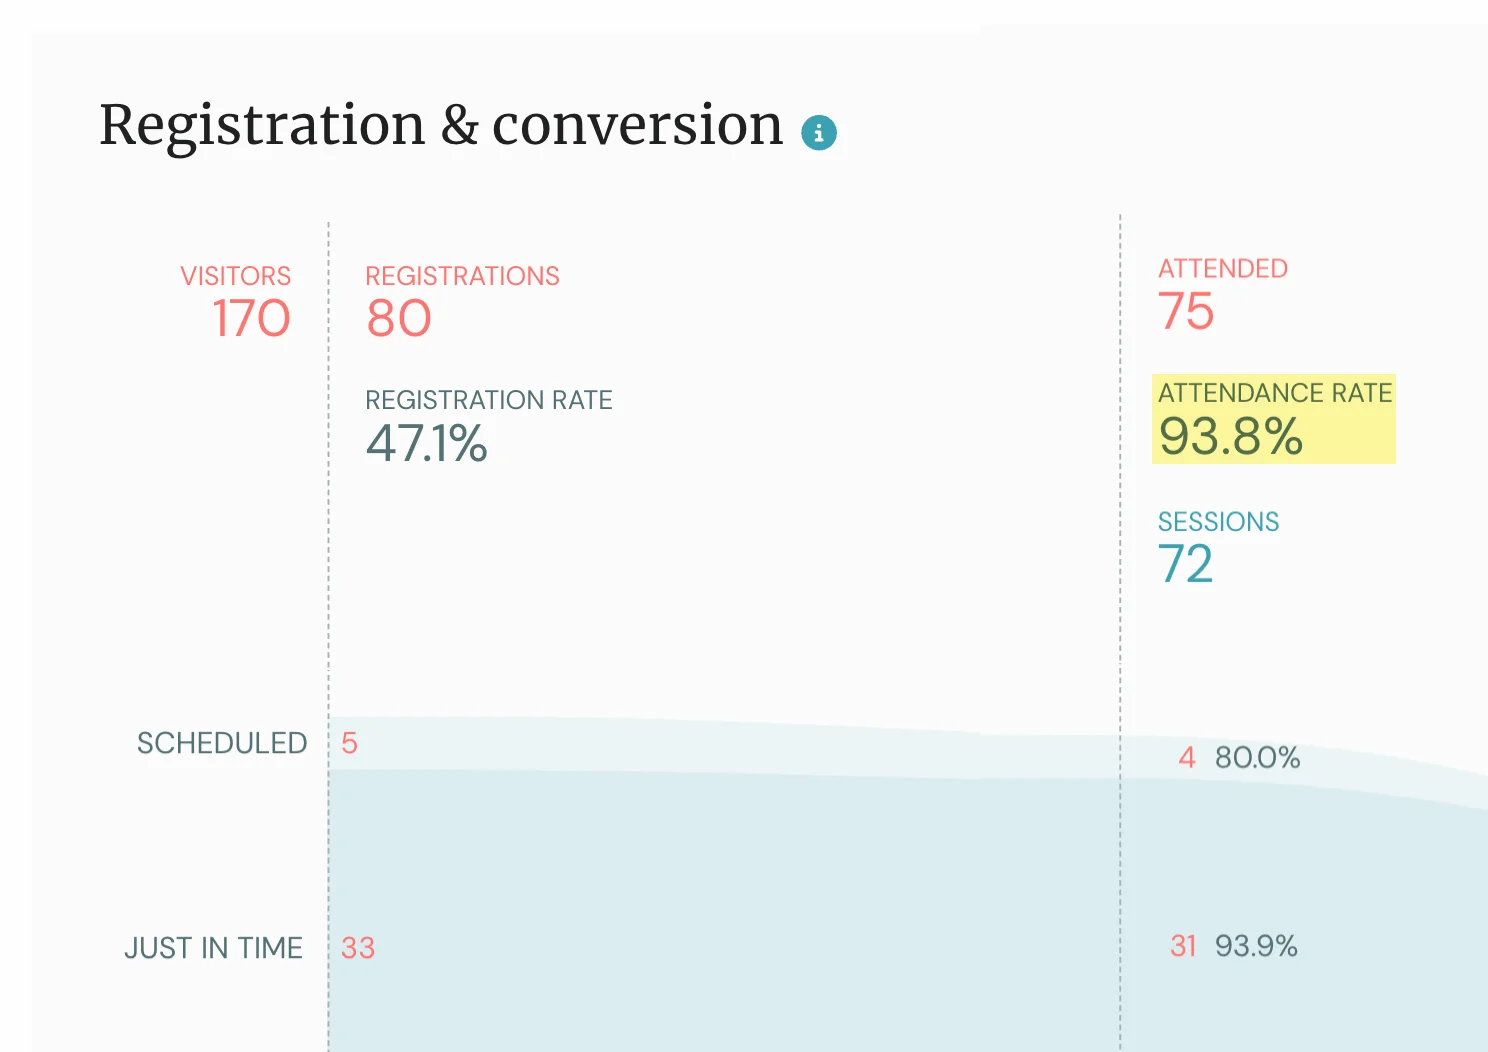
2. Attendance rate
Your attendance rate can be calculated by dividing the number of attendees who show up by the total number of registrants who signed up for the webinar. This will give you the percentage of people who followed through on attending.
The biggest determiner of attendance rate is how convenient it is for registrants to attend your webinar. If their schedule changes, they lose interest, or they’re traveling in a different timezone then they’ll likely just skip your webinar — even if they’ve already registered for it.
The best time and day to host a webinar is 11 AM or 2 PM and Wednesday or Thursday.
With that comes a new problem: time zones.
11 AM on a Wednesday for you might be Tuesday night for your customer and 2 PM on a Thursday could be super early for them on a Friday. This means it’s chronologically impossible for you to reach everyone during these optimal time slots if you’re hosting webinars live.
The reason that customers using eWebinar, our webinar platform, get an average attendance rate of 65% (with some getting upwards of 90%) is because our webinars are pre-recorded which makes it possible to run multiple sessions per day on autopilot.
You might think that automated webinars are less interactive because the presentation is recorded ahead of time. In reality, modern platforms like eWebinar have come a long way and our 20+ built-in interactions actually make our webinars more interactive than live webinars.
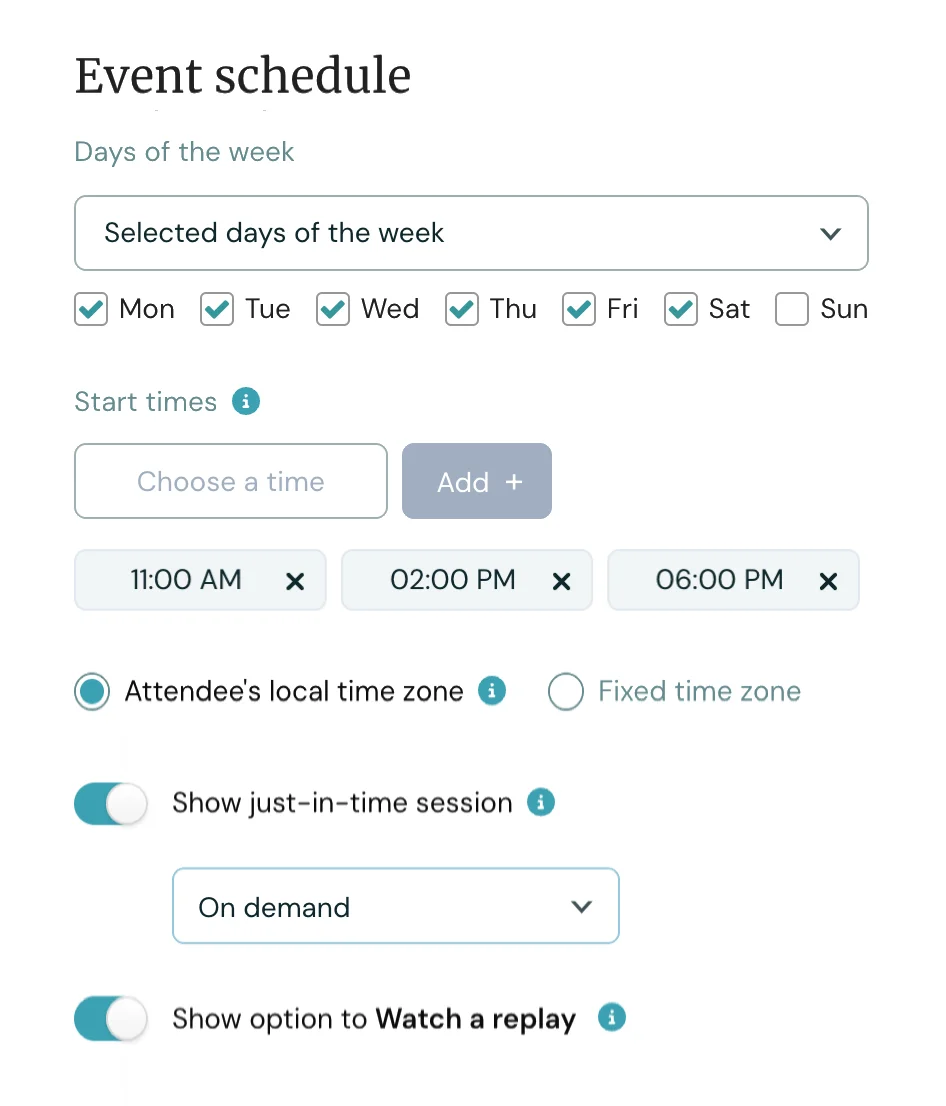
There are three scheduling types you get to choose from with eWebinar:
-
On-demand webinars. Offering on-demand sessions lets people watch your presentation right after they fill out the registration form. You can also enable "just-in-time" sessions for webinars that are automatically scheduled to start within a few minutes of a visitor landing on the page.
-
Recurring webinars. Running recurring webinars will help you capture leads who aren't ready to watch the presentation yet. We even have a dynamic time zone feature that can adapt the schedule of your webinars based on which time zone the registrant is in.
-
Webinar replays. Webinar replays — which have all the same live chat capabilities and 20+ interaction popups from standard eWebinar sessions — let attendees pause, play, and skip around the presentation like it was a YouTube video.
If you want to experience an on-demand webinar firsthand then watch our demo!
We're one of the few automated webinar platforms that let you enable all three scheduling options at once. Providing all these options simultaneously makes it as convenient as possible for your registrants to attend the webinar which leads to consistently high attendance rates.
To learn more, read our full guide on How to Increase Webinar Attendance Rates!
3. Average watch time
Watch time is the percentage of your presentation that an attendee watches. If you’re running an hour-long webinar and most of the audience leaves around the 30-minute mark then your average watch time will be 50%.
Virtual event analytics like average watch time will give you a clear idea of how the webinar itself went for the registrants who attended it. After all, watch times will help you gauge how interested the audience was and estimate how many people reached your webinar CTA.
For example, our webinar platform has a heatmap that shows you the exact point where attendees start leaving the presentation:

4. Engagement rate
Related to (but distinct from) watch time is engagement rate.
There are a few ways to measure how engaged the audience is such as:
-
How many attendees sent a message in the chat
-
How many people asked/responded to questions
-
How many people clicked the like button
These are just a few examples and which criteria you use will depend on the purpose of your webinar. If you’re running a sales webinar then you’d look at the number of sales or form submissions whereas you’d need different metrics to track other webinar goals.
The same heatmap we showed you in the previous section also includes event tracking data like when attendees left a message in chat, liked the presentation, or responded to an interaction.
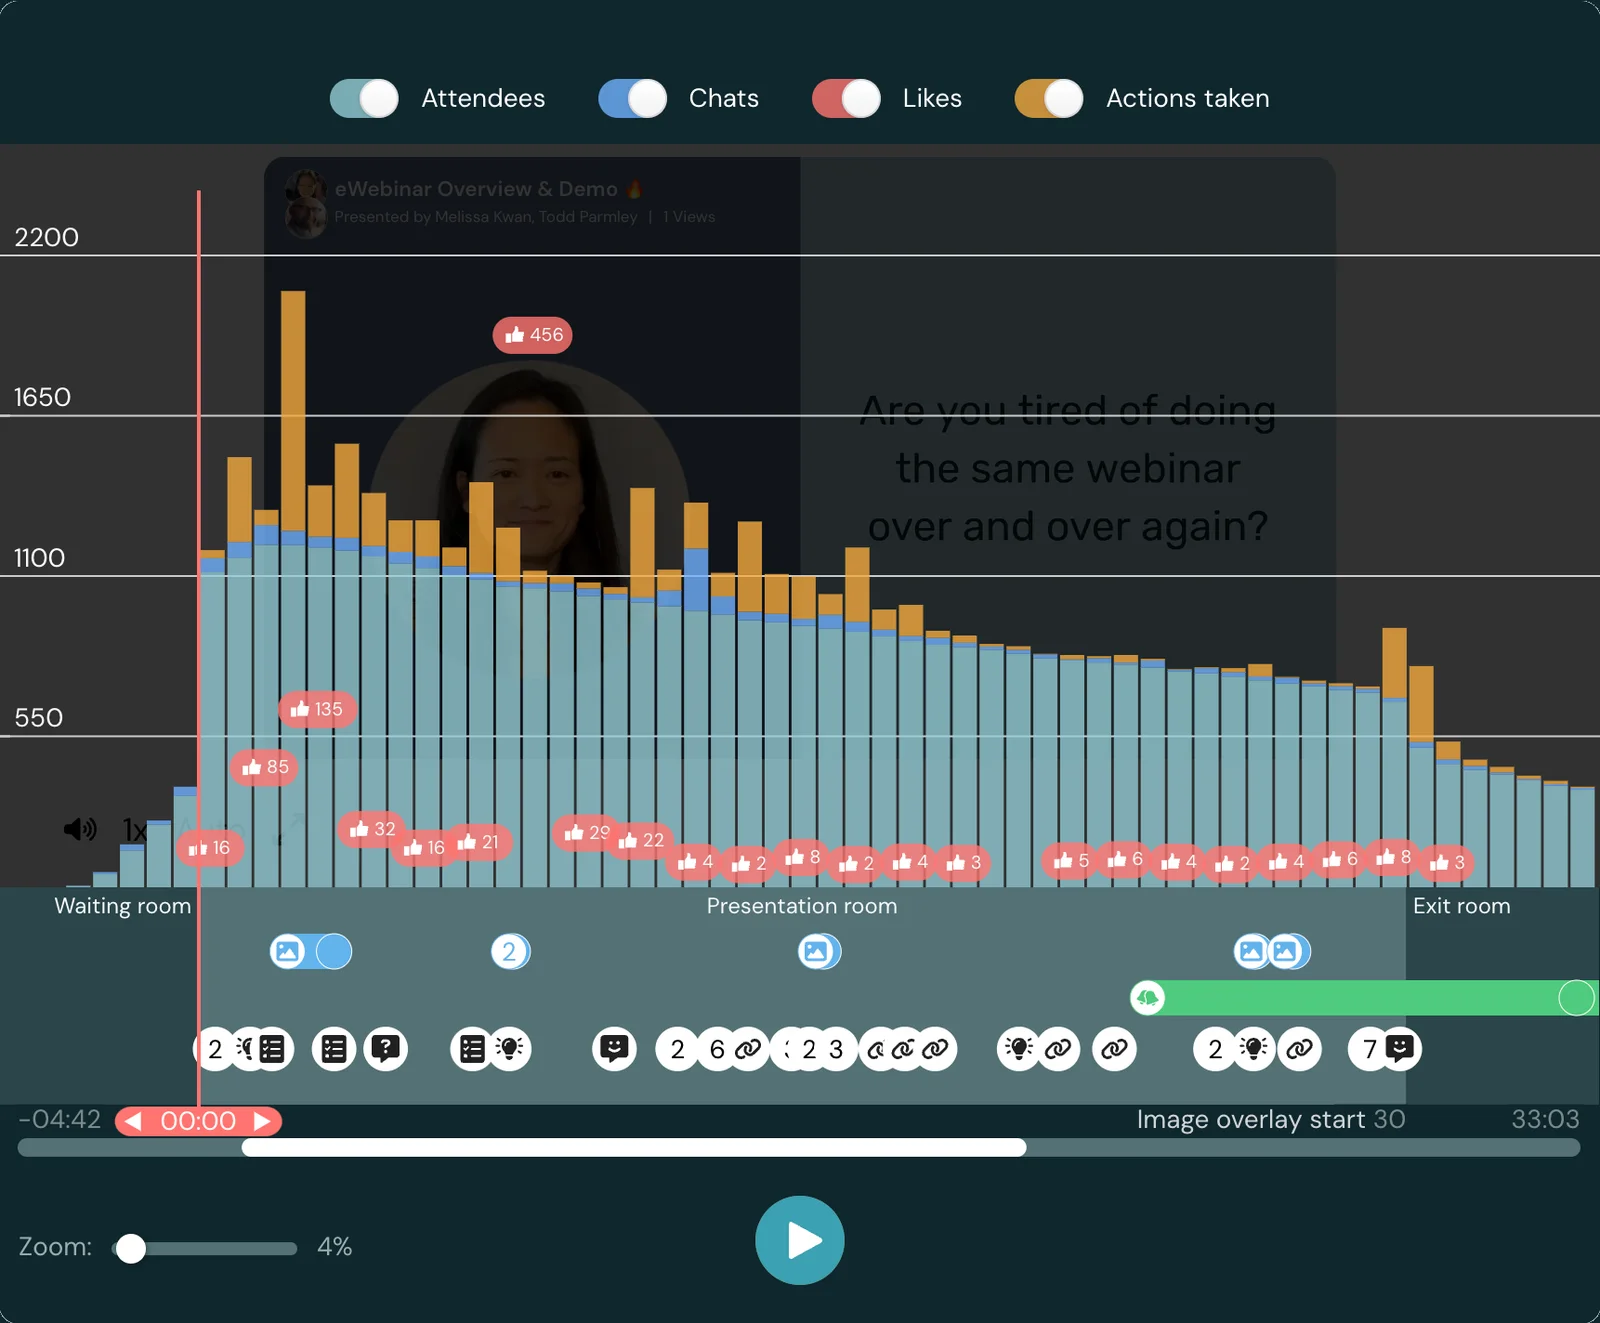
If you see engagement rates and watch times drop at a certain point then you'll have a clear idea of which part of the presentation loses user interest. Identifying these “dead zones” will help you figure out if you should pick up the pace or make certain segments more interactive.
Tip: You can automatically send the data from interaction responses to your CRM platform of choice by setting up an eWebinar integration.
5. Conversion rate
Finally, the conversion rate will show you the percentage of webinar attendees who performed the desired action and/or became a paying customer. How warm your traffic is (i.e. a returning audience of existing leads versus complete strangers) will also play a role in how many convert.
Last but not least, you’ll need a compelling call to action (CTA) that gets your webinar attendees to take that next step. Examples of CTAs include “Subscribe to our newsletter!”, “Order now!”, “Sign up for a free trial!”, or “Book a call!” — depending on what the next step for attendees is.
There are a few best practices that you should follow to craft high-converting webinar CTAs:
-
Focus on one primary CTA (but mention it more than once if necessary)
-
Spend 80% of the webinar providing value and roughly 20% making the ask
-
Use a proven presentation structure to warm attendees up for the CTA
-
Test multiple CTAs on your audience to see what resonates
-
Use the same CTA in your post-webinar follow-up emails
Tip: The most successful webinars are those that are able to reliably drive conversions on autopilot so read our full guide on How to Build a High-Converting Automated Webinar Funnel!
Our product, eWebinar, makes tracking conversions easy with a visualization of your sales funnel:
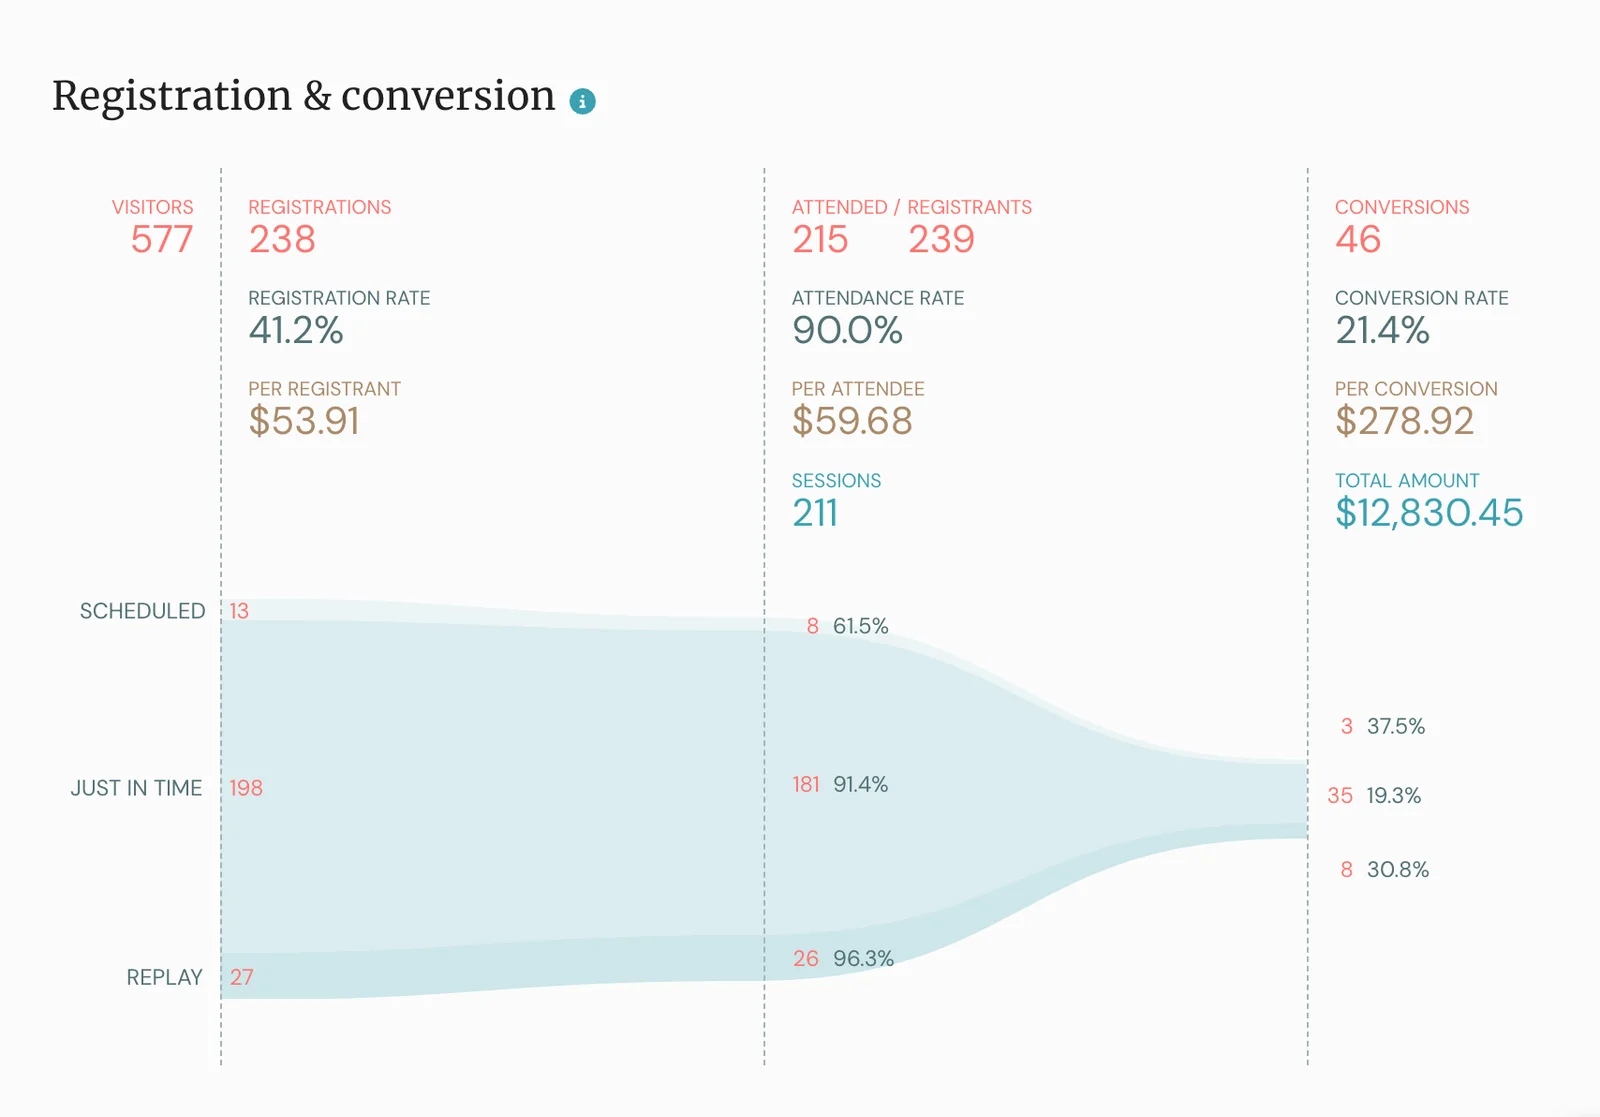
This dashboard shows you the percentage of leads who made it to the next step so you can identify the bottleneck in your webinar funnel. You'll also be able to see which webinar type — scheduled, just in time, or replay — generated the most leads or conversions.
You can also see the revenue per conversion and total revenue generated.
Tip: Not every attendee will be ready to convert at the end of your webinars. To avoid losing leads who are on the fence, be sure to send webinar follow-up emails!
Some webinars are a one-time event but if you’re doing sales webinars, product demos, or any other presentation that you give over and over again then you’ll have the unique opportunity to optimize its conversion rate with each repetition.
Once your webinar is converting efficiently, the next step would be to automate it so you can reach more people with a presentation that you already know converts well. Watch our demo to see how we use on-demand webinars to drive sales on autopilot!
Acting on data
Webinar data analytics are only useful if you actually use the data to optimize your webinar strategy.
Applying these insights to iterate on your landing page, presentations, and follow-up emails will help you continuously improve each stage of the webinar funnel. In turn, this leads to performance increases after each round of tweaking.
You can also use this data to make webinars interactive and improve audience engagement.
Our platform also has built-in viewer engagement tools like the 20+ interactions you can choose from:
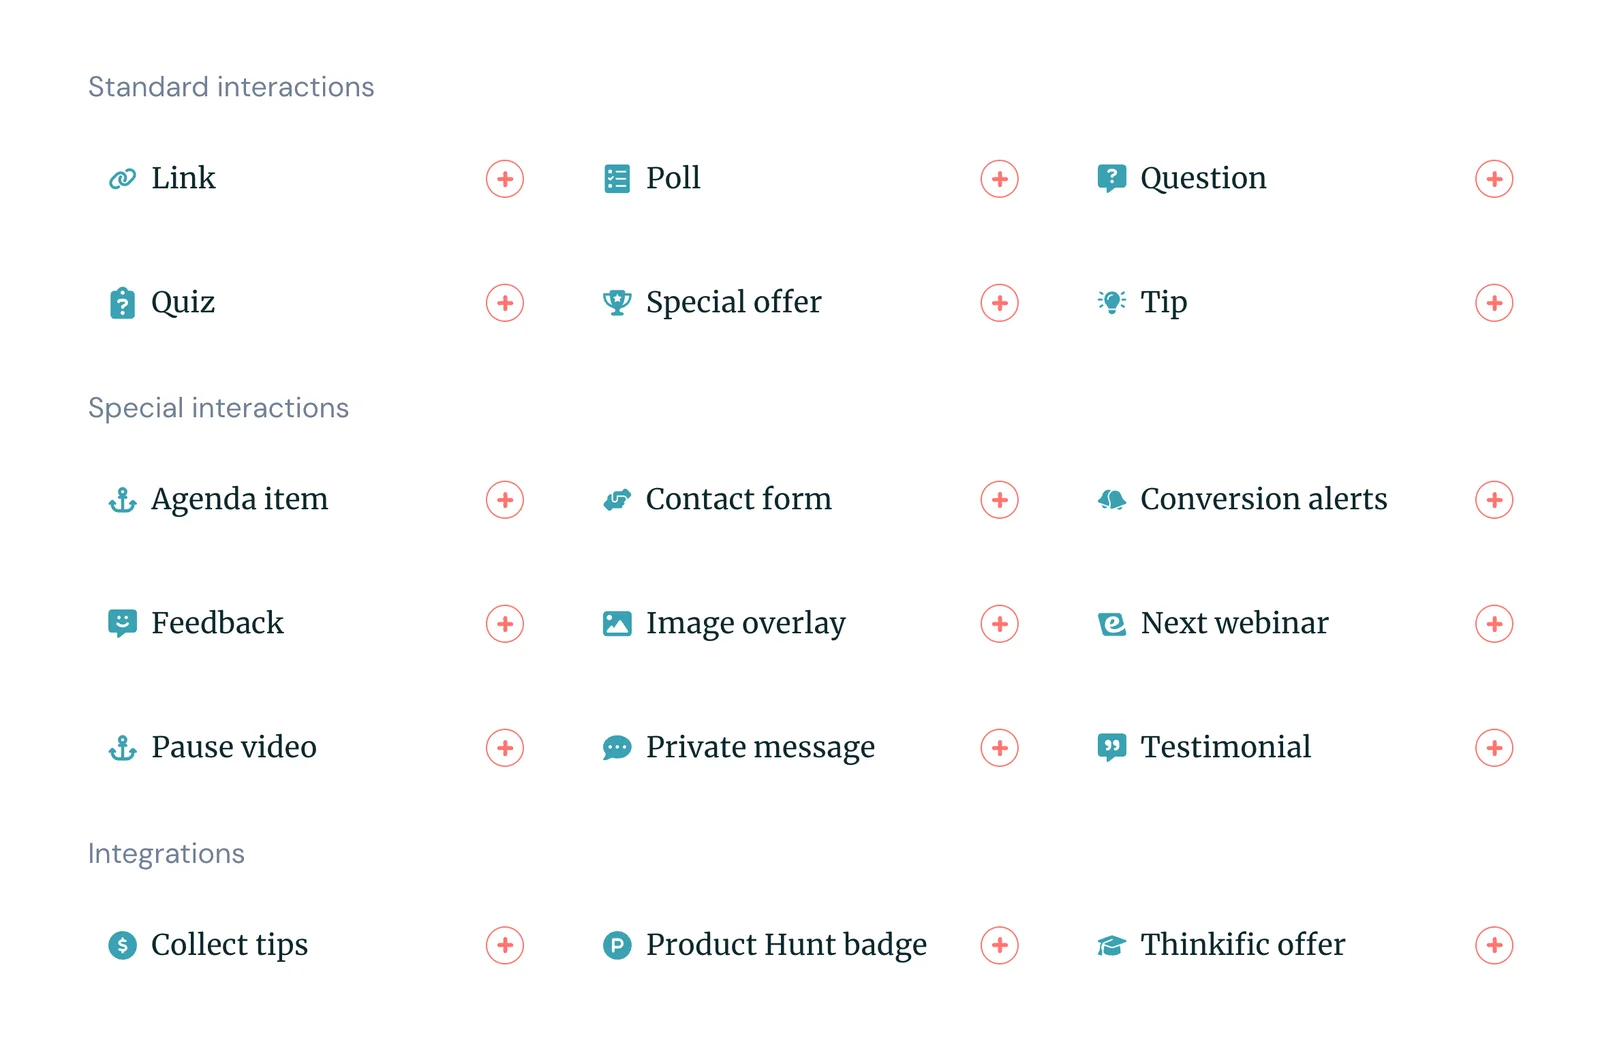
Combining this with the watch time analytics we covered earlier, you'll be able to strategically insert interactions in the drop-off points where viewership starts declining. This is especially important for lead nurturing webinars that want to keep the audience engaged as long as possible.
You can also use certain interactions — such as polls and questions — to survey attendees:
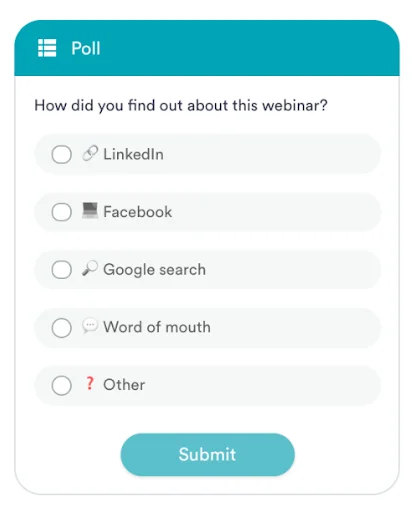
The qualitative attendee feedback gathered through these interactions will yield valuable insights and help you (or your marketing team) refine follow-up emails based on the problems or goals of your target audience. You'll also be able to use these responses to improve future webinars.
Tip: You can automatically send the data from interaction responses to your CRM platform of choice by setting up an eWebinar integration. This lets you segment leads based on whether they attended your webinar (and how far they watched) so you can personalize the follow-up.
Data from analytics and attendees will help you improve every single webinar until it's as close to perfect as (practically) possible. At that point, you can automate it to reach more people and turn your online events into a well-oiled conversion machine that generates conversions on autopilot.
In other words, your focus shifts from optimizing to scaling.
Conclusion
Unveiling webinar analytics will help you run a successful webinar with more registrants, attendees, and conversions. Once you've used data to optimize your live presentation, the next logical step is to automate upcoming webinars to reach more leads at scale.
You won't even need to spend extra money on third-party webinar analytics tools or data management systems since the eWebinar platform comes with analytics reporting built into the product itself. If you'd like to experience our advanced webinar analytics for yourself then watch our demo!