

Actionable Analytics
See what's working (or not) so you can make your webinars better.
Find out how well your webinars are performing by tracking key metrics like registration, attendance, engagement, watch times, conversion, and the time you've saved with eWebinar!

Find out how well your webinars are performing by tracking key metrics like registration, attendance, engagement, watch times, conversion, and the time you've saved with eWebinar!

Get all of the details behind attendance and watch times.
See how attendance and watch times break down by session type, plus who left early vs stayed till the end.
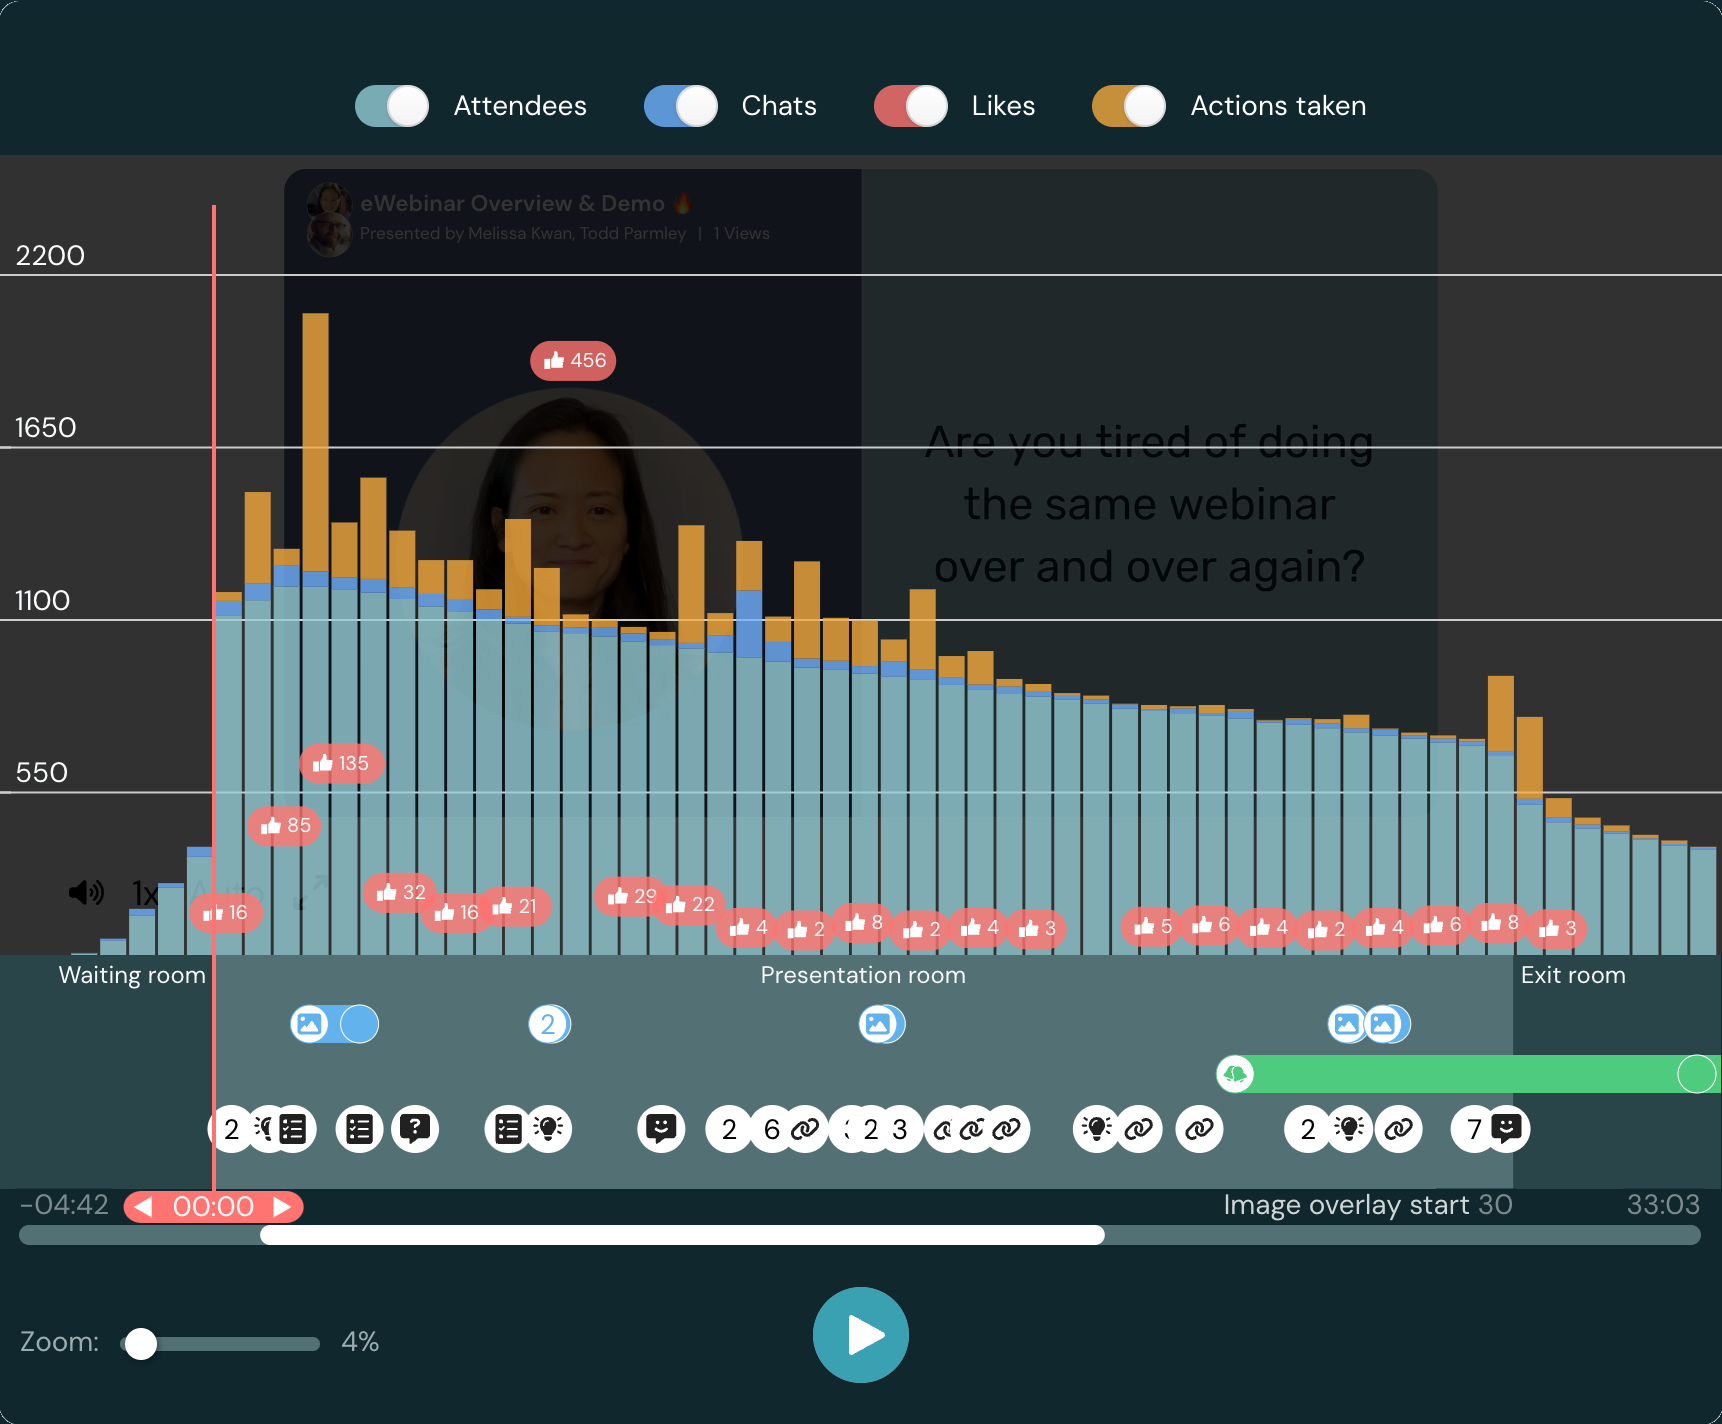
Diagnose when people are engaging versus dropping off.
An engagement heat map lets you see how much and in what ways attendees are participating in your webinar – or if the experience is falling flat.

Analyze responses to polls, questions, and quizzes.
Discover how interactions are performing relative to each other, review individual attendee responses and send them to your CRM for audience segmentation.

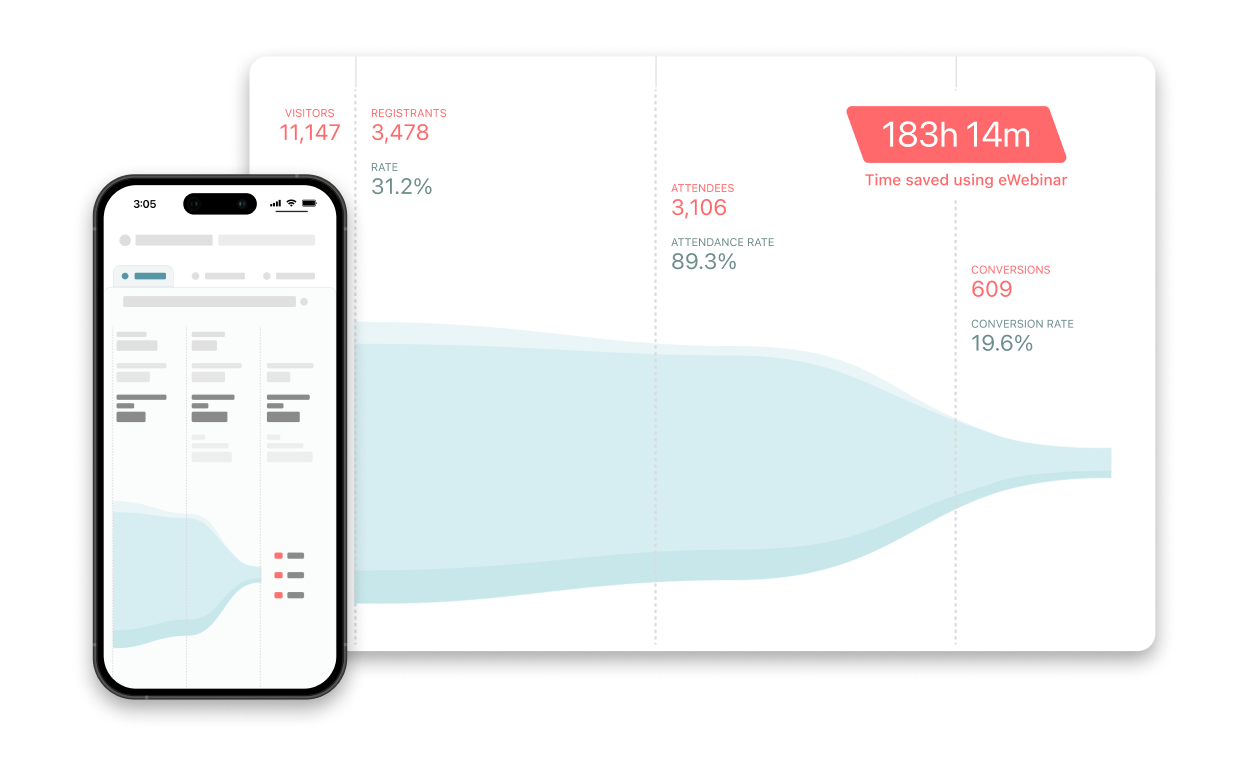
Track every step of your conversion funnel.
From visitors to registrants to attendees to conversions, monitor how healthy your funnel is at every single stage.

Easily share reports with your team or manager.
Filter your analytics by date range, customize the resulting report, and share it with others without the hassle of them having to log in.

Find everything for all of your webinars — analytics, registrants, and chat — in one spot.
Subscribe to our Universal Dashboard to track unique registrants and run analytics across all or any combo of your webinars. Respond to all chat from one inbox. And get universally better data!
Analytics at a glance
-
 Number of visitors (traffic)
 - Registrants & registration rate
- Attendees & attendance rate
- Engagement rate
- Average watch time
- Conversion rate
- Interaction responses & stats
- Stayed till end vs left early
- Segmentation by session type
- Hours saved via automation
- Recent activity schedule
- Number of sessions
- Interactive engagement heat map
- Visualized conversion funnel
- Conversion tracking code
- Filter metrics by date range
- Customizable reports to share
- Copy & paste text summary
Universal Dashboard at a glance
- Shareable cross-webinar analytics
- Compare webinar performance
- Include all or specific webinars
- Unique registrants (by email)
- Consolidated registrant record
- One chat inbox for all webinars
- Cleaner, more accurate data
- Data combined across sessions
- Flexibility when filtering data
- "Best" registrant data sent to CRM
- 1 row per registrant in downloads
- Webinar dashboard upgraded too!
Don’t take our word for it
Hear from our customers

Dusty Jostes
Product Marketing Manager at FBS
Dusty Jostes
Product Marketing Manager at FBS
eWebinar rocks! Their analytics report saves me so much dang time! It's the only report I look forward to compiling come quarterly board report time.

Will Yang
Head of Growth at Instrumentl
Will Yang
Head of Growth at Instrumentl

Paul Thomson
Webinar Consultant

 Play video
Paul Thomson
Webinar Consultant
eWebinar is the most exciting webinar tool I've seen. Here are some current stats from a client: 27.8% registration rate, 63.7% attendance, 82.1% avg watched (1hr long) and a 416% ROI!