Virtual event metrics are essential for measuring the impact that your events have and determining whether or not they're achieving the goals you set out to. This in-depth guide will walk you through the top five virtual event KPIs to track and optimize so you can maximize the ROI on future events.
Let's dive in!
Virtual Event Metrics and KPIs
Here are the metrics and KPIs we'll cover in the sections below:
Attendance
Attendance is the most important metric for virtual events because every other KPI hinges on your ability to get people to show up for your virtual event. Pumping thousands of dollars into paid ads won't make a difference if the registrants you get don't follow through by attending the event.
Thankfully, the attendance rate is also the easiest metric to calculate since you simply have to divide the number of people who attended by the total number of registrants. Event attendance will mainly come down to whether your online events are happening live or available on-demand.
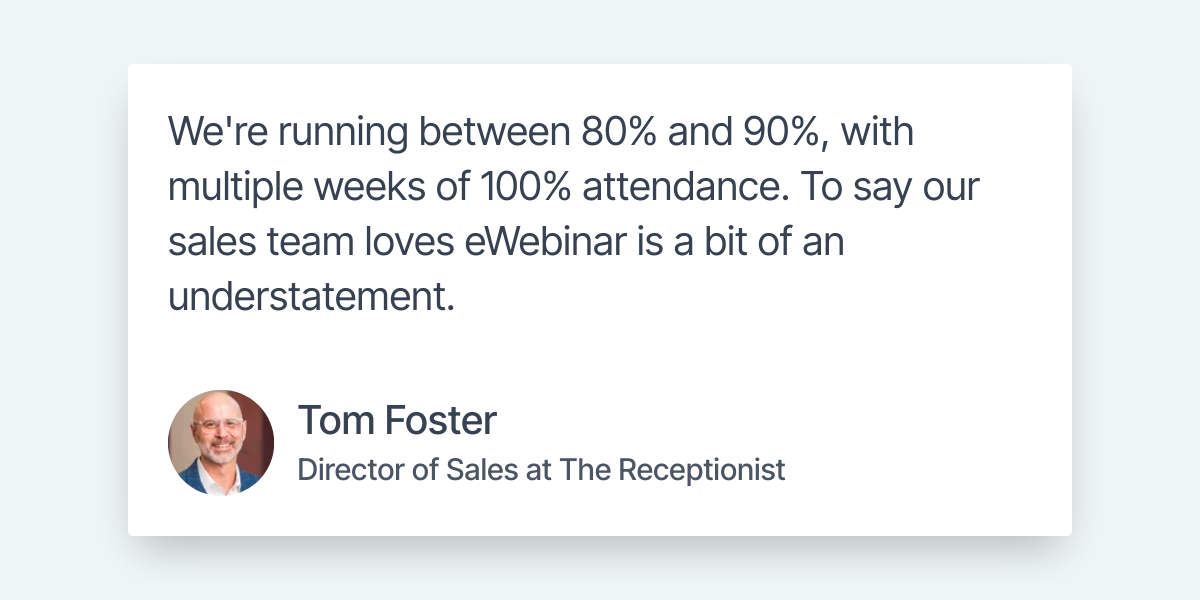
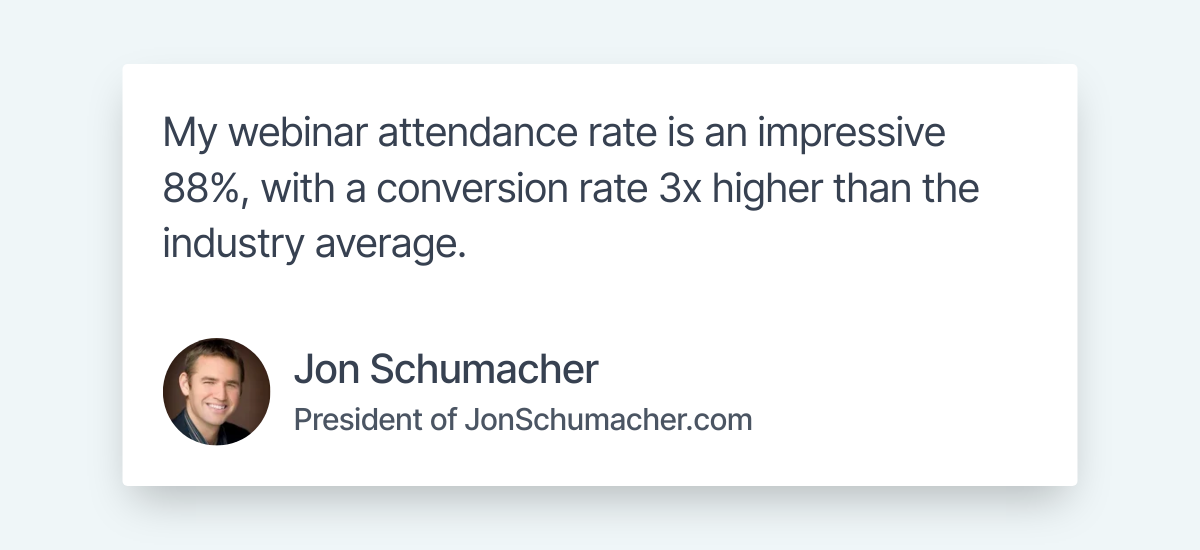
For instance, the average attendance rate for live webinars is 40% while automated webinars (hosted on our webinar platform eWebinar) get an average attendance rate of 65%. In fact, many of our customers get considerably higher attendance rates in the 90% to 100% range:
While research exploring the best time and day to host a webinar (or other virtual event) does exist, the simple fact is that pre-recording your presentation then letting people watch it at their convenience will yield the largest improvements to your attendance rates.
These benefits aren't limited to conversion-focused events either since customer success teams have been able to drastically increase attendance by making their onboarding and training webinars available on demand or automating them on a recurring schedule.
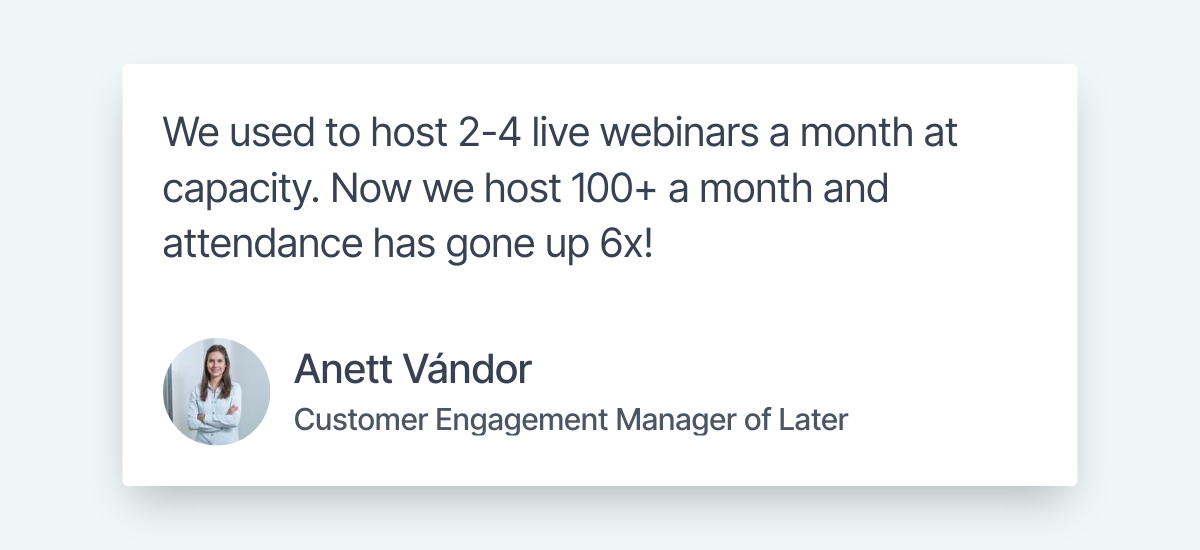
For instance, the team at Later managed to 6x attendance to their customer success webinars using the power of automation:
It's important to remember that pre-recorded webinars don't have to make for a passive viewing experience. To experience just how interactive and engaging an automated webinar can be nowadays, watch our on-demand demo!


Note: We use eWebinar to demo eWebinar.
Registration
While it's true that attendance rates will be the largest bottleneck you need to eliminate in order to host successful virtual events, that doesn't mean that trying to increase the number of registrations isn't worth your while.
Ramping up your webinar promotion to send more high-quality traffic into your webinar funnel or promoting an upcoming online event from within a SaaS product are just a couple of examples of how you can get more people to sign up.
Regardless of which marketing channels you use to increase registration, there are a few ways you'll want to splice the data in order to extract valuable insights:
-
Total registrants. First and foremost, you should be keeping a close eye on the number of registrants you're able to amass and how that number changes from one event to the next. Also be on the lookout for repeat registrants that have attended multiple events.
-
Registration rate. Your registration rate is the percentage of landing page visitors who register for the webinar. Your registration rate primarily hinges on the performance of a high-converting landing page.
-
Registrant source. The next layer down is figuring out where the majority of your registrants are coming from. This will help you identify the most effective event marketing channels and allocate resources accordingly.
-
Cost per registrant. Finally, it's crucial to keep track of how much you're spending to acquire each registrant. If you spend $10,000 on your marketing efforts but only get 100 registrants then your cost per registrant would be $100 and you'd need to observe whether you're still getting an ROI.
Knowing how many registrants you get, where they come from, and how much each channel costs equips you to make an informed decision on where to focus your efforts. For instance, you might find that social media engagement is a more cost-effective way to get registrants than paid advertising.
Engagement
Another key category in virtual event success metrics is engagement. Knowing how many people registered and showed up isn't enough, you also have to keep tabs on how engaged attendees were during the event.
Your overall engagement rate can be calculated by dividing attendees who engaged in any capacity by the total attendee count and then multiplying by 100 to get a percentage. You can even drill down into specific types of engagement such as chat or poll engagement.
Whether or not audience members participate in the event will have a huge impact on the event's success. As such, you should pay attention to engagement KPIs like how many chat messages attendees sent and the number of poll responses received.
Tip: You can use polls, quizzes, and similar interactions to gather feedback from attendees or track event data.
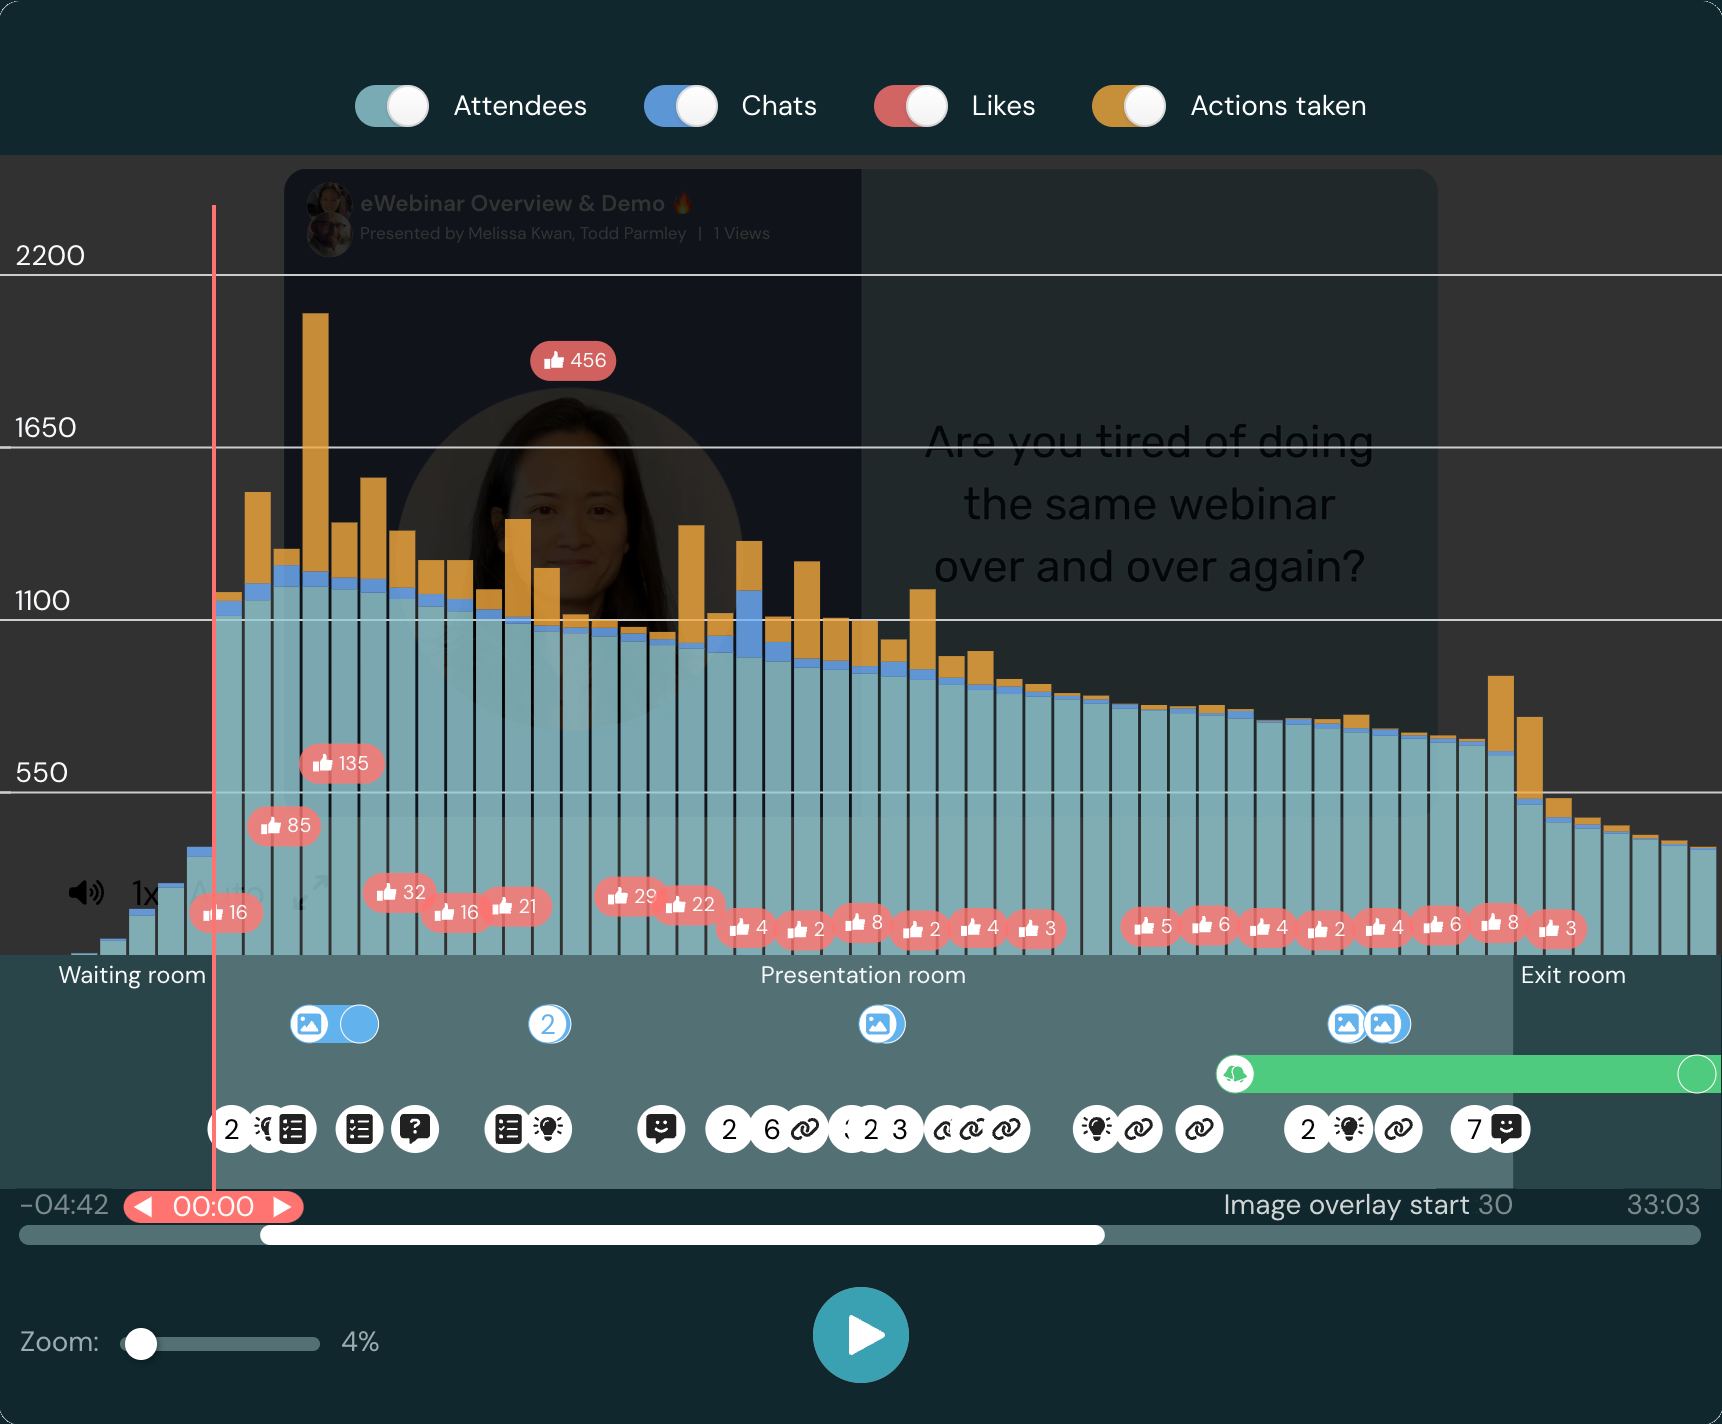
Ideally, the software you use would be capable of providing a unified view of all relevant engagement metrics. Those using eWebinar can use our engagement heatmap to see how the number of viewers, messages, likes, and actions drop off throughout the course of the event.
If you notice lackluster attendee engagement rates, there are plenty of engagement strategies that you could leverage such as Q&A segments or breakout rooms. However, live chat will undoubtedly be the most effective path to audience engagement because it enables two-way communication in real time.
This is why choosing software with robust chat capabilities is so important when comparing different virtual event platforms. To learn more about what to look for and which options to consider, read our full guide on the 10 Best Webinar Platforms!
Conversions
For sales teams, the obvious virtual event KPI is always going to be conversions. This can be measured based on the number of sales made during/following a virtual event, the total revenue attributed to the event itself, or the overall conversion rate.
The conversion rate can be calculated by dividing the number of conversions by the total attendee count for the event and then multiplying by 100 to get a percentage. If 20 conversions occurred in an event with 100 attendees then that’s a conversion rate of 20%.
Sales teams might also use the number of sales-qualified leads (SQLs) as a supplementary KPI if the event was hosted with lead generation in mind. Even better would be to look at the full conversion funnel to see which stage needs further optimization.
Tip: If you use automated webinars to generate leads then attendees can watch the recorded presentation in order to qualify (or disqualify) themselves as leads before ever taking up your sales team's time.
For example, eWebinar's funnel reports show you the number of conversions, conversion rate, amount per conversion, and total amount of revenue generated by an automated webinar:
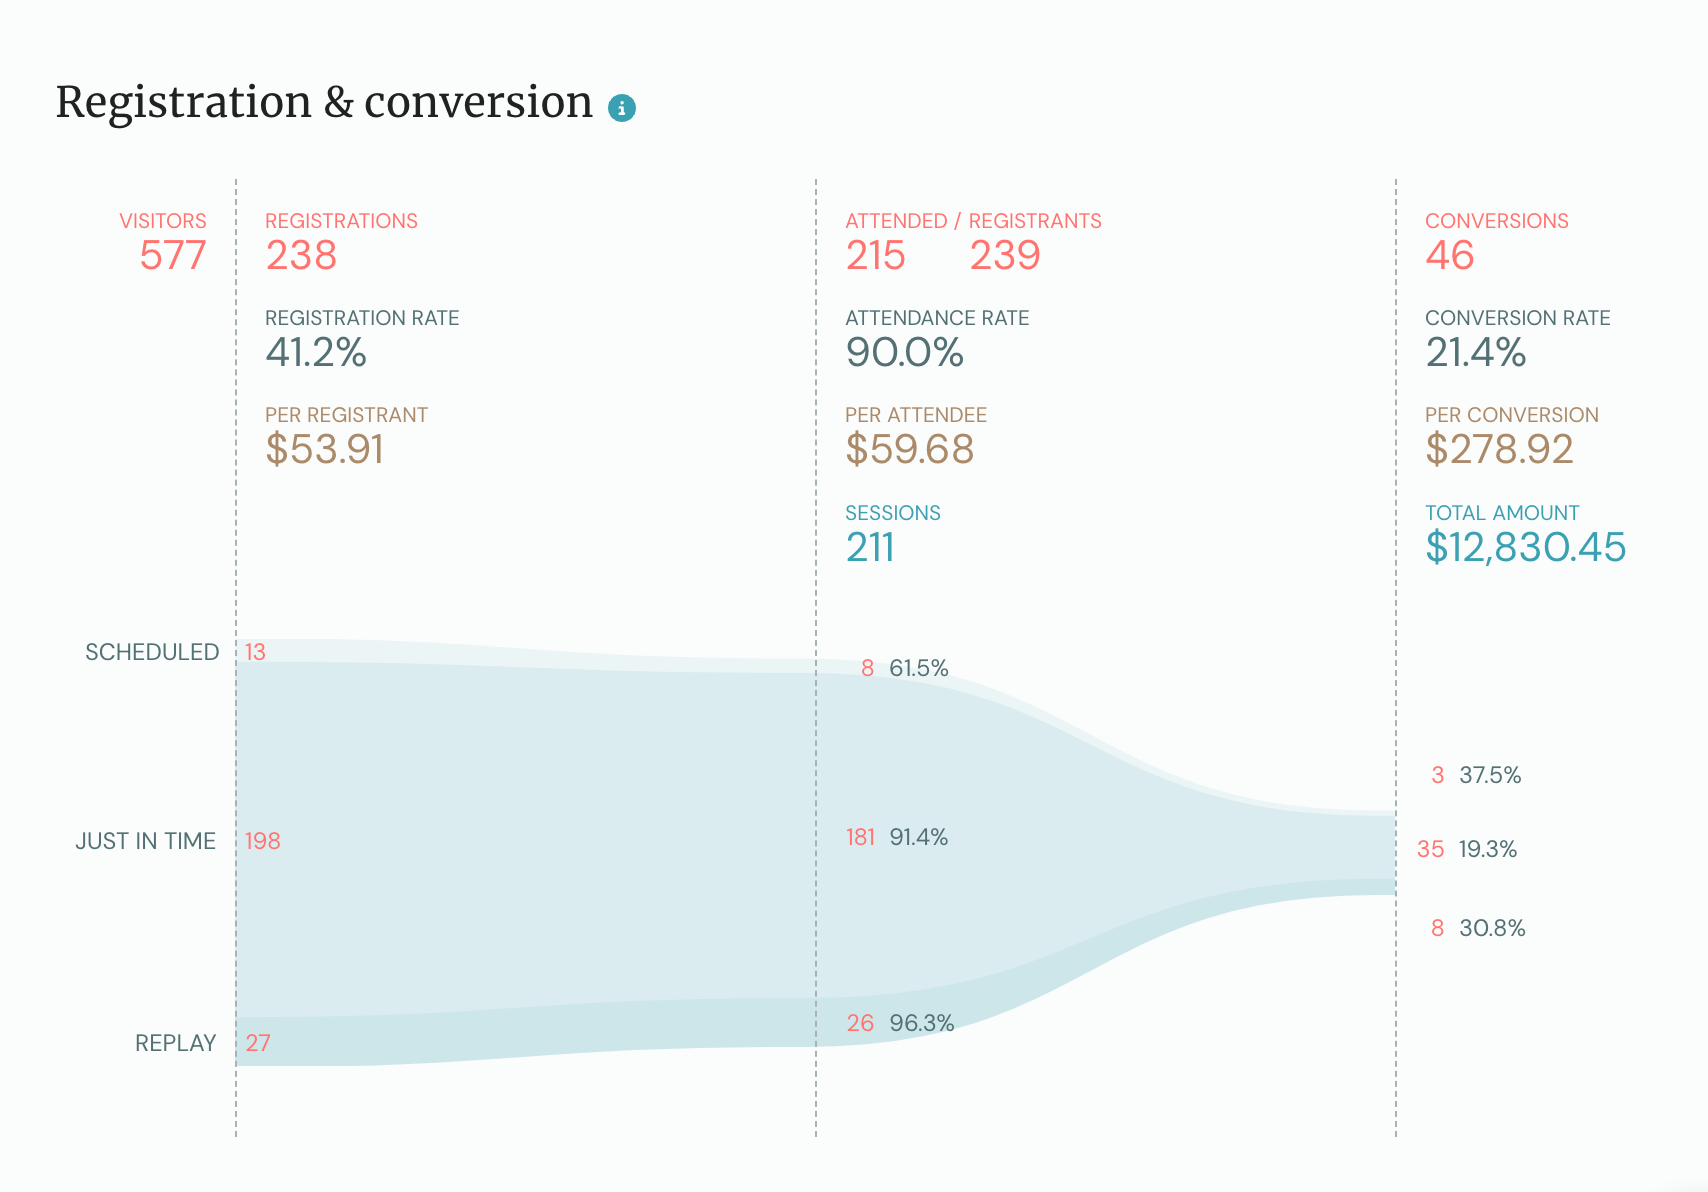
Your mileage may vary depending on the analytical capabilities of your own virtual event platform so be sure to pick software with easy-to-use analytics dashboards — ideally with third-party CRM integrations that automatically sync conversion data.
Net promoter score (NPS)
Generating sales isn't always the goal especially if you're running events for people who are already customers. A prime example would be customer success teams hosting onboarding and training webinars for new (or existing) users of their product.
In such cases, you should be more concerned with audience sentiment and overall satisfaction with the event. The easiest way to measure the net promoter score of attendees would be to run a post-event survey or insert a poll interaction into the webinar itself.
Simply ask: “On a scale of 1-10, how likely would you be to recommend this event to others?”
Based on their response, you must then categorize attendees into three groups:
-
Promoters. Scores of 9-10 are considered promoters who are happy enough with the event to promote it to others in a positive light.
-
Passives. Scores of 7-8 are passives who were satisfied with the virtual event but weren’t thrilled enough to mention your event to others.
-
Detractors. Scores of 0-6 are classified as detractors who could be detrimental to your event by leaving negative reviews of their experience online.
Once your attendees have been categorized, you can then take the percentage of promoters and subtract the percentage of detractors to get your net promoter score. Passives aren’t factored into the equation at all since they’re inconsequential to its future promotion.
In addition to the quantitative scores that attendees provide, you should also analyze their qualitative responses to open-ended questions. This type of feedback is more detailed and can help you understand the reasoning behind a particularly high or low score.
Tip: Responses from detractors can be just as (if not more) valuable as those from promoters. By figuring out what you did wrong, you’ll be able to avoid making the same mistakes at your next event.
All in all, collecting NPS feedback will help you to measure the overall satisfaction rate of your audience and aid in personalizing the attendee experience when planning upcoming events.
Conclusion
We hope the key performance indicators in this guide help you measure event success and take a data-driven approach to your event planning. If you're interested in leveraging webinar automation to increase attendance and get a higher virtual event ROI as a result then watch our on-demand demo!


